What is Activity Monitor on macOS and How Do I Use It?
The macOS Activity Monitor gives you various views of what’s happening on your computer right now. It helps you troubleshoot as well.
Activity Monitor on macOS is one of those tools you probably won’t need to use very often. However, when you do, you’ll appreciate the information it contains and its ease of use. Here’s more about it and why it’s important to your Mac’s long-term health.
macOS Activity Monitor
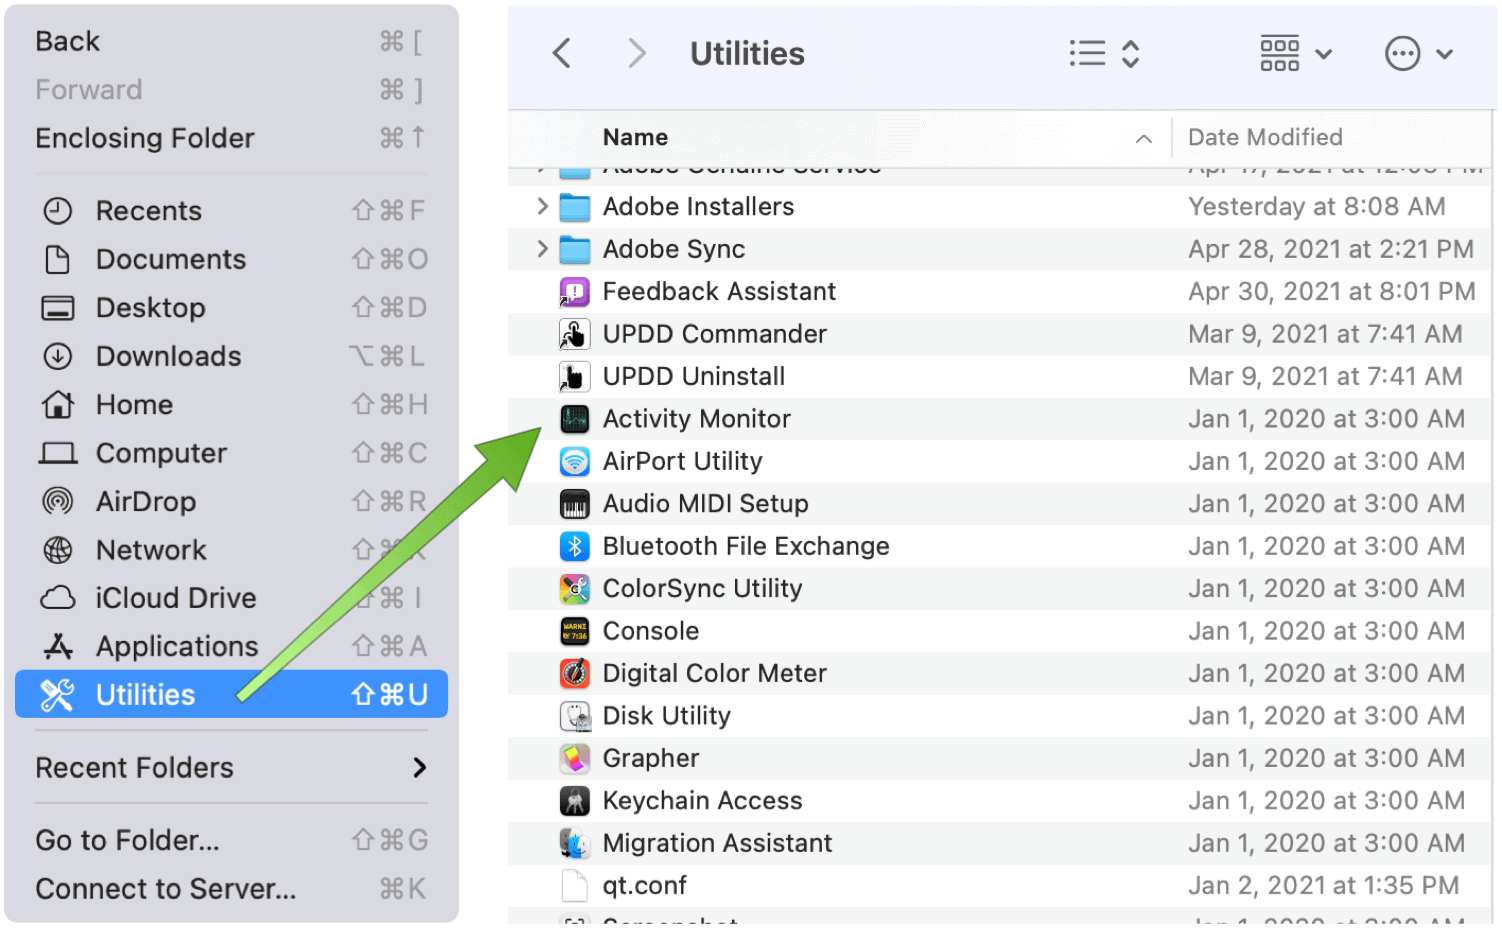
The somewhat hidden Activity Monitor shows what’s currently running on your Mac. Better still, it shows in graphical form which programs and processes are affecting your Mac’s performance. You can find the Activity Monitor through Spotlight or the Go menu for Finder under Utilities. The Activity Monitor is located by clicking Go on the Finder menu bar in the Applications folder under Utilities. Included in the tool are three tabs: CPU, Memory, Energy, Disk, and Network.
Information presented under the macOS Activity Monitor is updated every five seconds, but you can update information more frequently for more precise monitoring. Choose View > Update Frequency to change the setting.
Viewing Activity
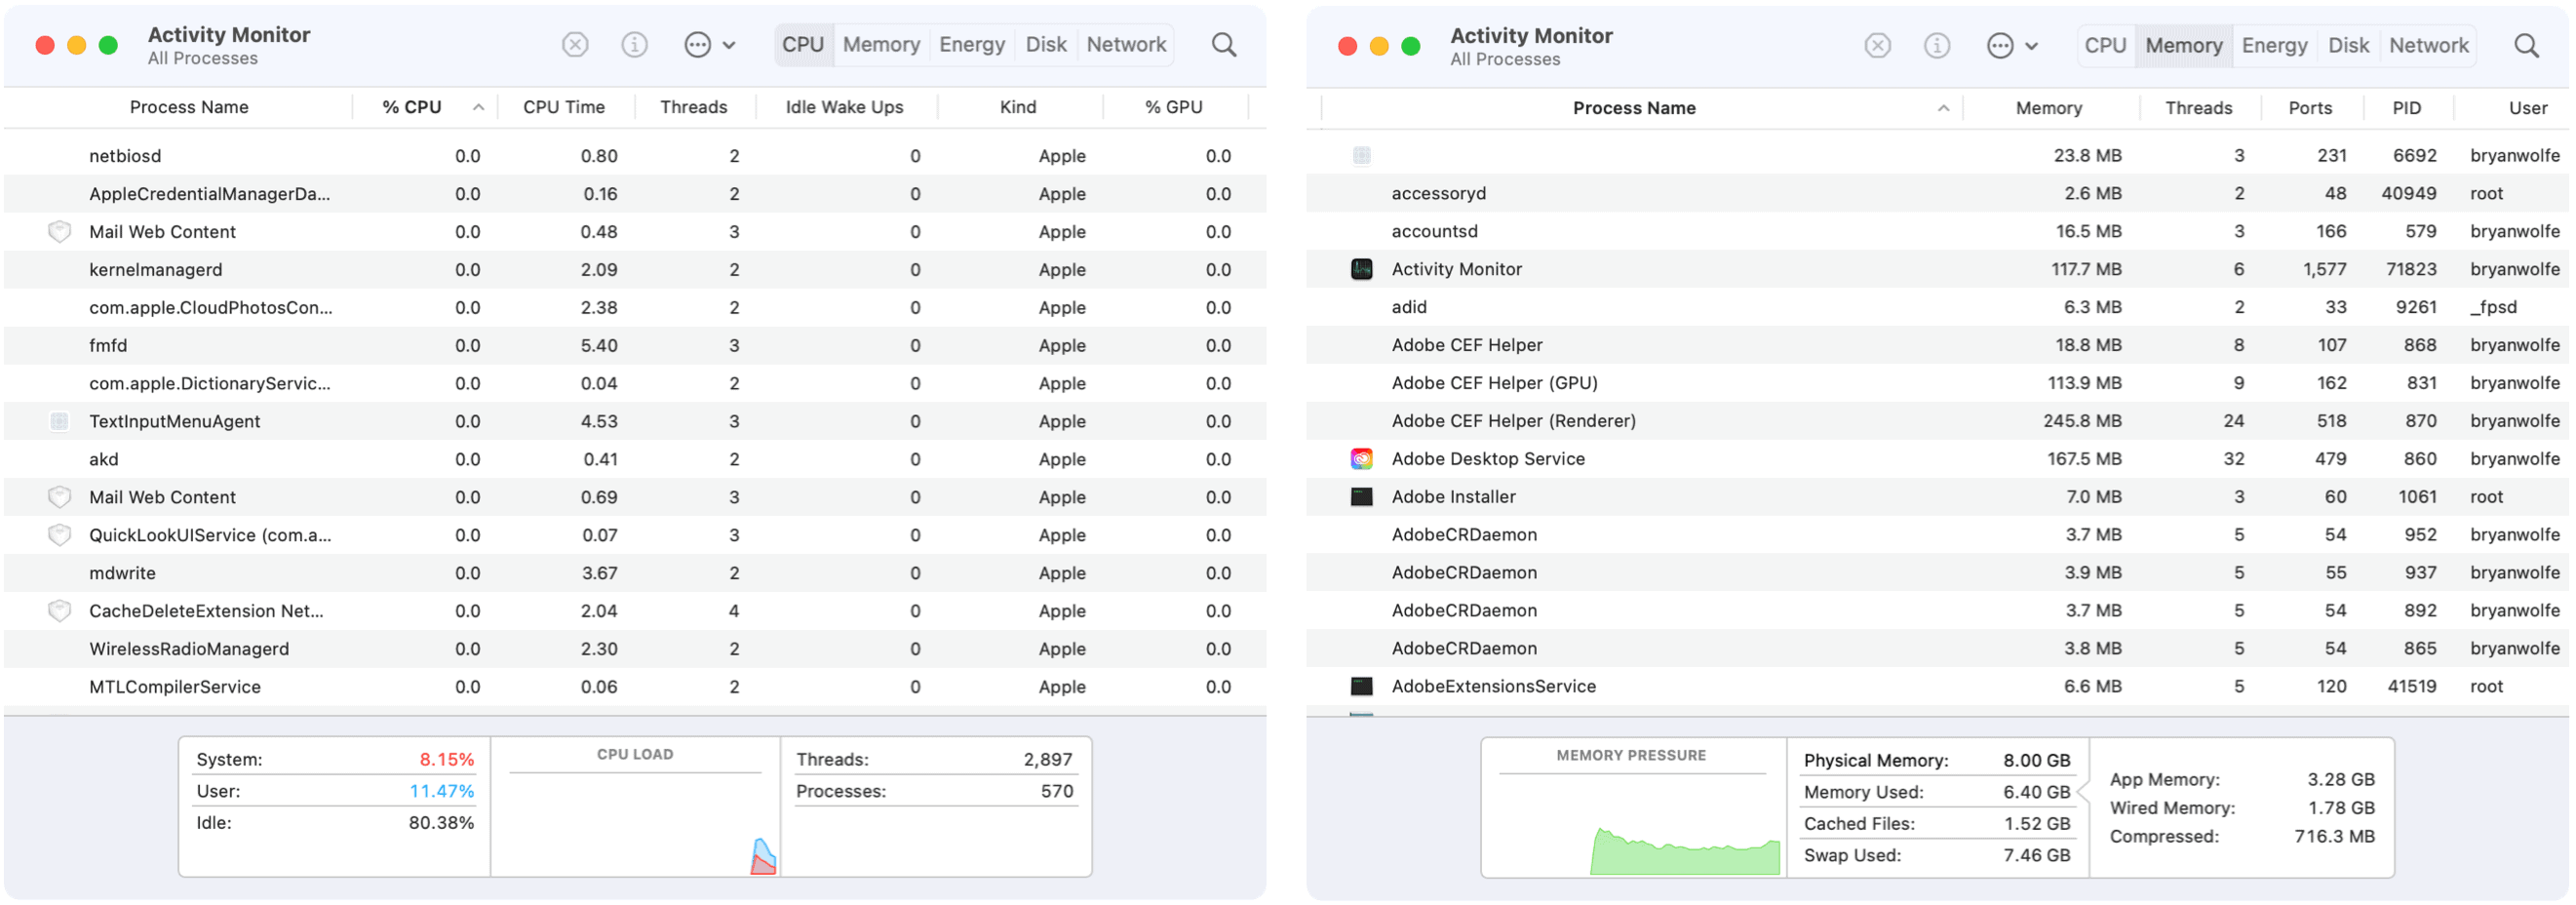
By definition, processes on your Mac will ultimately affect your computer’s performance. Processes take many forms, including apps, system apps, and invisible background processes. With Activity Monitor, you can see how much memory and CPU time each process uses in real-time.
Under each tab in the monitor, you’ll find current information about each running process. Under CPU, for example, are CPU time and percentage, and other columns easily sorted. The Memory tab, by contrast, shows how much memory is being used by the same processes.
To view process activity, do any of the following:
- To see more information, select the process, then doubt-click it or click the Info button in the Activity Monitor window.
- Sorting processes is achieved by clicking on a column heading to change the view.
- Click the triangle in a selected column heading to reverse its order.
- Enter the name of a process or app in the search field to search.
Customized Activity Monitor Viewing
To view more columns:
- Select View > Columns for the monitor, then choose the columns you want to show by checking them off.
You can also group processes for easier viewing by clicking on View on the Activity Monitor menu bar. Choices include:
- All Processes: This shows all the processes running on your Mac.
- All Processes, Hierarchically: Shows processes that belong to other processes so that you can see the parent/child relationship between them.
- My Processes: Shows processes owned by your user account.
- System Processes: Shows processes owned by macOS.
- Other User Processes: Shows processes that the root or the current user doesn’t own.
- Active Processes: Shows running processes that aren’t sleeping.
- Inactive Processes: Shows running processes that are sleeping.
- GPU Processes: Shows running processes owned by the computer’s GPU.
- Windowed Processes: Shows processes that can create a window. These processes are usually apps.
- Selected Processes: This shows only processes you selected in the Activity Monitor window.
- Applications in last 12 hours: Show only the apps running processes in the last 12 hours.
- Processes, by GPU: Shows running GPU processes grouped by GPU.
Other Discoveries
The monitor doesn’t only show current CPU and memory information. You can also find the following by taking the necessary steps:
- For GPU, go Window > GPU History.
- To view energy information, click the Energy tab, and choose View > Columns to include more viewable columns. The energy use of individual apps and their processes is displayed in the upper part of the Activity Monitor window.
- For disk activity, click Disk in the monitor window. To see a graph of disk activity, choose View > Dock Icon > Show Disk Activity.
- For network activity, click the Network tab, and look for information in the bottom graph.
- To see cache content, select the Apple icon on the menu bar, choose Preferences, and then Sharing. Select Content Caching. Once you do, you’ll be able to view Cache information through Activity Monitor, just like you view CPU, Memory, etc.
- Tap the System diagnostics button to bring up a menu of diagnostic tools for troubleshooting purposes. Typically, Apple support will instruct you to do these.
Why Is This Important?
The information contained in the Activity Monitor isn’t just for viewing. You can also stop processes that are acting sluggish or not responding by force-quitting. To do this, highlight a process under the CPU tab, then click the “X” icon at the top. Confirm to quit the process. See if that corrected your issue. If not, continue searching.
For more information, visit the Apple Support webpage on the Activity Monitor.
Looking for more information about macOS? Recent stories featured how to use the Apple Music Autoplay feature from your desktop, setting up Activation Lock to protect your files, and taking screenshots and video on macOS Big Sur.


