How to Import Stock Prices and Geography Into Excel

Unlike charts and graphs where you need to fill in the data, the stock price and geography tools in Excel let you import (and update in real-time) live data from the web.
Most people know how to add charts or graphs in Excel, but did you know you could also import stock prices and geographical information as well?
Unlike charts and graphs where you need to fill in the data, the stock price and geography tools in Excel let you import (and update in real-time) live data from the web. Let’s take a look at how this works.
Note: The following features are only available in Excel for Microsoft 365 (for desktop and web), and Excel for iPad, iPhone, and Android devices.
How to Import Stock Prices Into Excel
Before trying to create a full dashboard, it’s a good idea to learn how to do a simple data import first. Stock prices are very easy to bring into Excel. However, if you don’t know how it works, just clicking on the Stocks tool won’t do anything at all.
Here’s how it works.
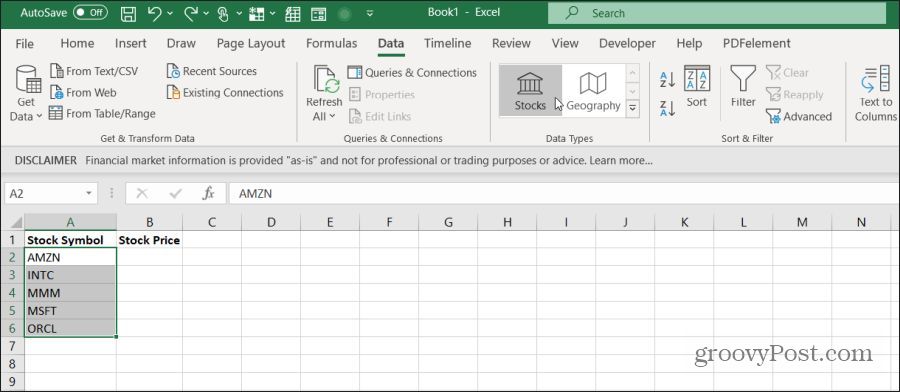
To get started, create a column in Excel and list all of the stock ticker symbols you want stock quotes for. Select all of those symbols. Then, select Data from the menu, and in the Data Types group in the ribbon, select Stocks.
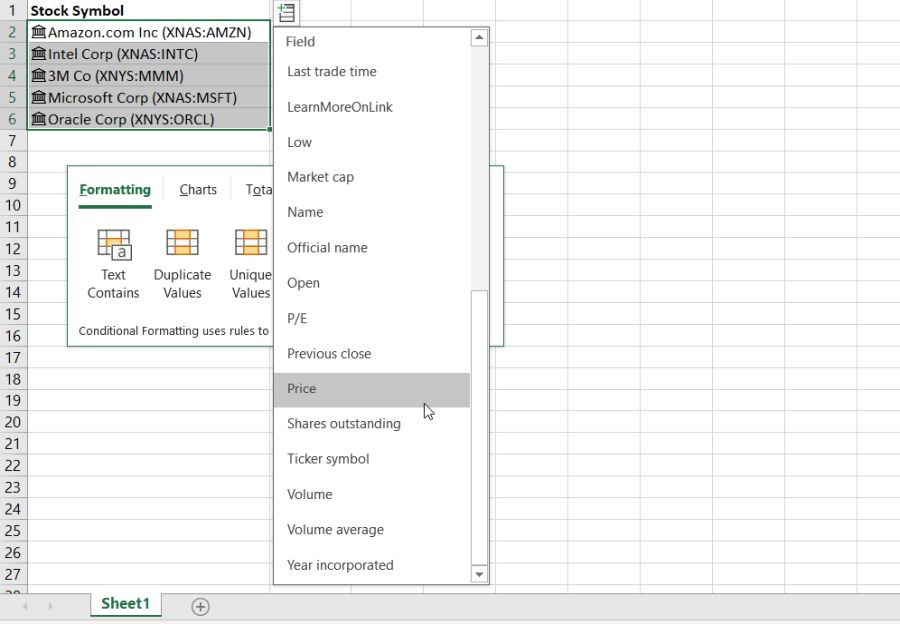
Excel will access the internet and obtain the data for the symbols you’ve selected. You’ll know this was successful because the symbol will change to the correct name of the company.

Now you’re ready to add stock data to your spreadsheet. Select all of the symbol cells again, and you’ll see two icons appear. One will appear at the top, and the other at the bottom.
- Insert Data (top): This lets you import data from the web into the column to the right of the stock symbol.
- Quick Analysis (bottom): This normally appears when you select multiple cells to quickly add tables or charts. You can ignore this icon.
When you select the Insert Data icon, you’ll see a drop-down list of data points you can import from the web.
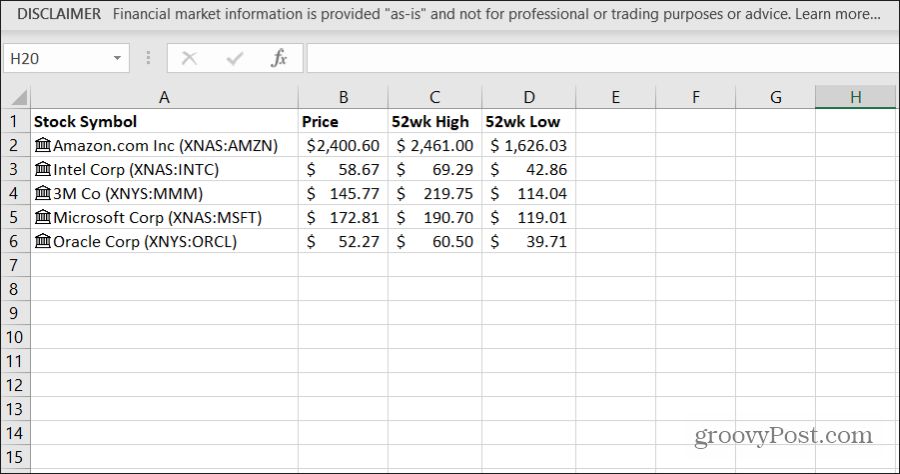
Add each data point, one at a time. You’ll see the latest data from the web show up in the next column to the right.
You can get updated data by selecting the Refresh All icon in the Queries & Connections group on the ribbon.
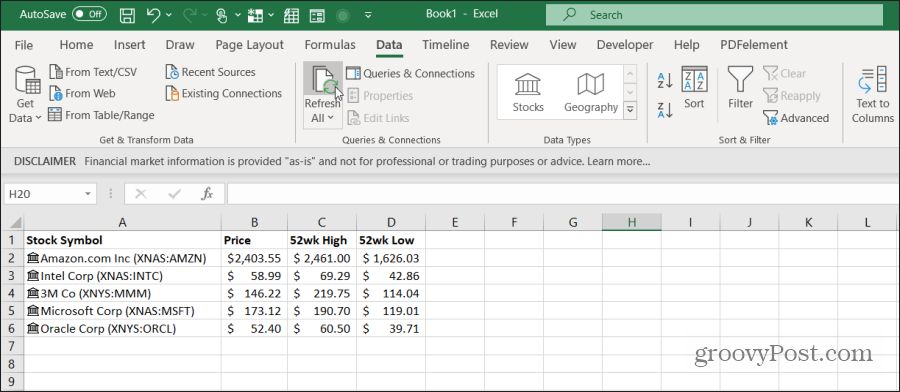
You’ll need to select Refresh All to get the latest stock data. However, there’s a VBA trick to configure auto-refresh, which helps when you’re trying to create a live dashboard. You’ll learn how to enable auto-refresh in the last section of this article.
How to Import Geography Into Excel
Bringing information about different countries works in the same way as pulling in stock data.
The easiest way to do it is to create a column with a list of countries you want to pull data for.
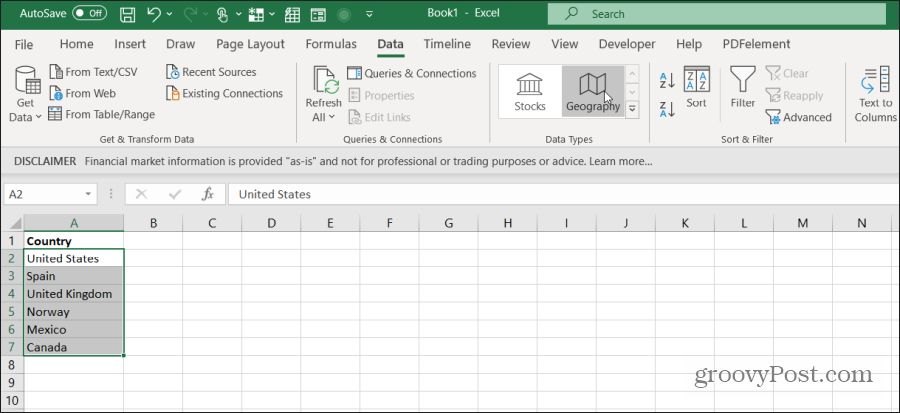
Next, select Data from the menu, and select Geography from the Data Types group in the ribbon.
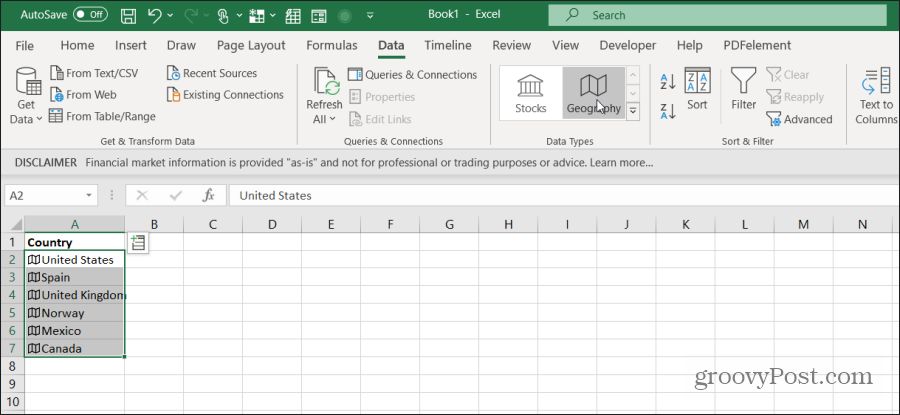
You’ll know the countries were recognized as valid by the icon that appears to the left of the country name. This also means there are data sets available for those countries.
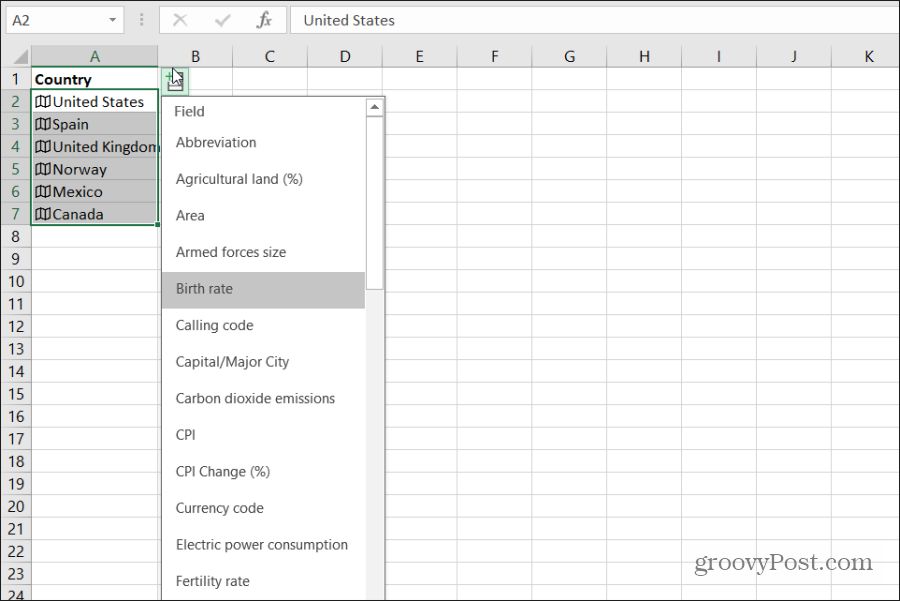
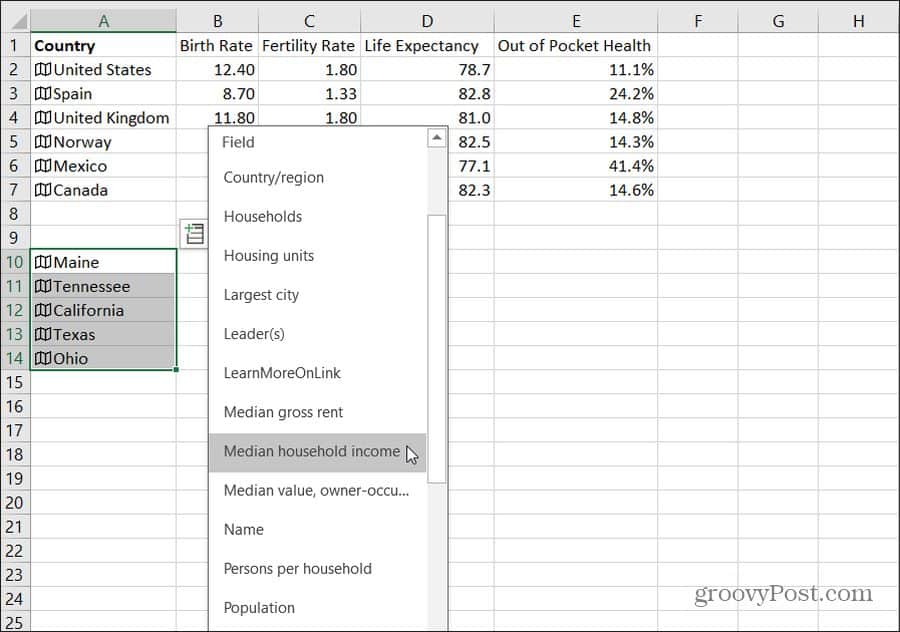
To see the data sets, highlight the cells again. Then, select the field icon at the upper right of the column. You’ll see a drop-down of all of the available datasets.
Just as with pulling in stocks, select each field one at a time.
As you add each data field, they’ll appear in the column to the right. Remember to label the column headers so you’ll remember what data you imported.
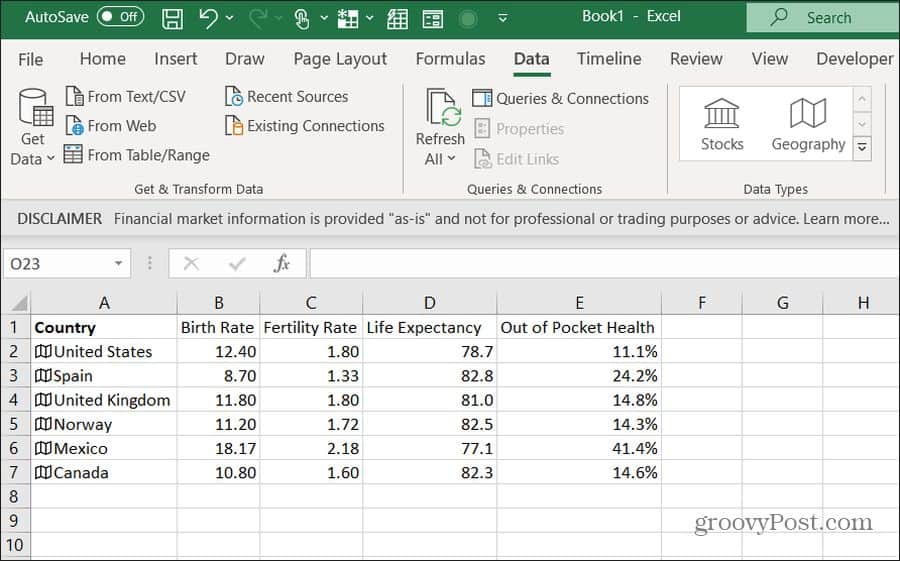
As you can see, it’s fast and easy to import geographical datasets using the Geography tool in Excel. This is also a great way to do research and find correlations in country-related data.
Keep in mind that you aren’t only limited to country data. Any geographic identifier will do. For example, you might want to compare income and population data between several U.S. states. Just type the states and repeat the process above.
This works for the names of cities and towns as well.
Refreshing Stock and Geography Data in Excel
You have all of the data in your spreadsheet, but you want to see the data live. Selecting Refresh All manually can get annoying. Excel doesn’t have a way to automatically update refresh Stock or Geography information, but that doesn’t mean it can’t be done.
To do this, you’ll insert special VBA code that’ll launch when your spreadsheet opens.
Select Developer from the menu, and in the Controls section of the ribbon select View Code.
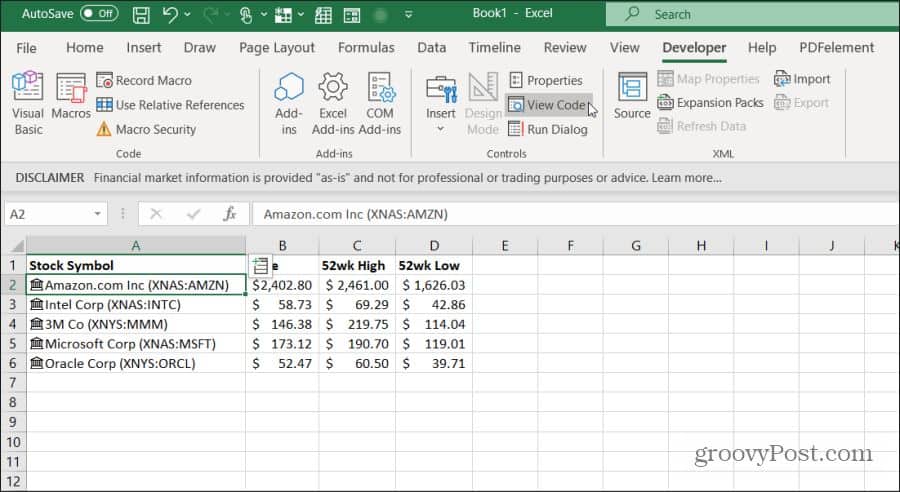
Note: If you don’t see Developer in your Excel menu, then add it. Select File, Options, Customize Ribbon, and select All Commands from the left drop-down. Then move Developer from the left pane to the right and select OK to finish.
Once you’re in the code editor, you need to find the right code that will launch when your spreadsheet opens. To do this, double-click ThisWorkbook to select that object. From the left drop-down menu over the code panel, select Workbook. From the right drop-down, select Open.

Finally, paste the following code inside the Workbook_Open() function:
ActiveWorkbook.RefreshAll

NextTime = Time + TimeSerial(0, 1, 0)

Application.OnTime NextTime, "AutoRefresh"
Safe this code and the Excel file as a macro-enabled Excel file (.xlms). The next time you open it, all of the stock or geography data you’ve imported into excel will refresh every minute. You can alter the code to have the data update more or less frequently if you wish.
This is just one example of creative Excel tips that can improve your productivity, there are many other great Excel tips out there.


